Yes and percent
yes_pct.Rdyes_pct calculates the count and percent of a user specified value in var2 for each level of a var1.
yes_pct(df, var1, var2, value, plot = FALSE)Arguments
- df
A data frame containing the data set to be analyzed.
- var1
The variable containing the levels to be grouped and summarized.
- var2
The variable you want to count the number of occurrences of a certain value.
- value
The value from var2 to be counted.
- plot
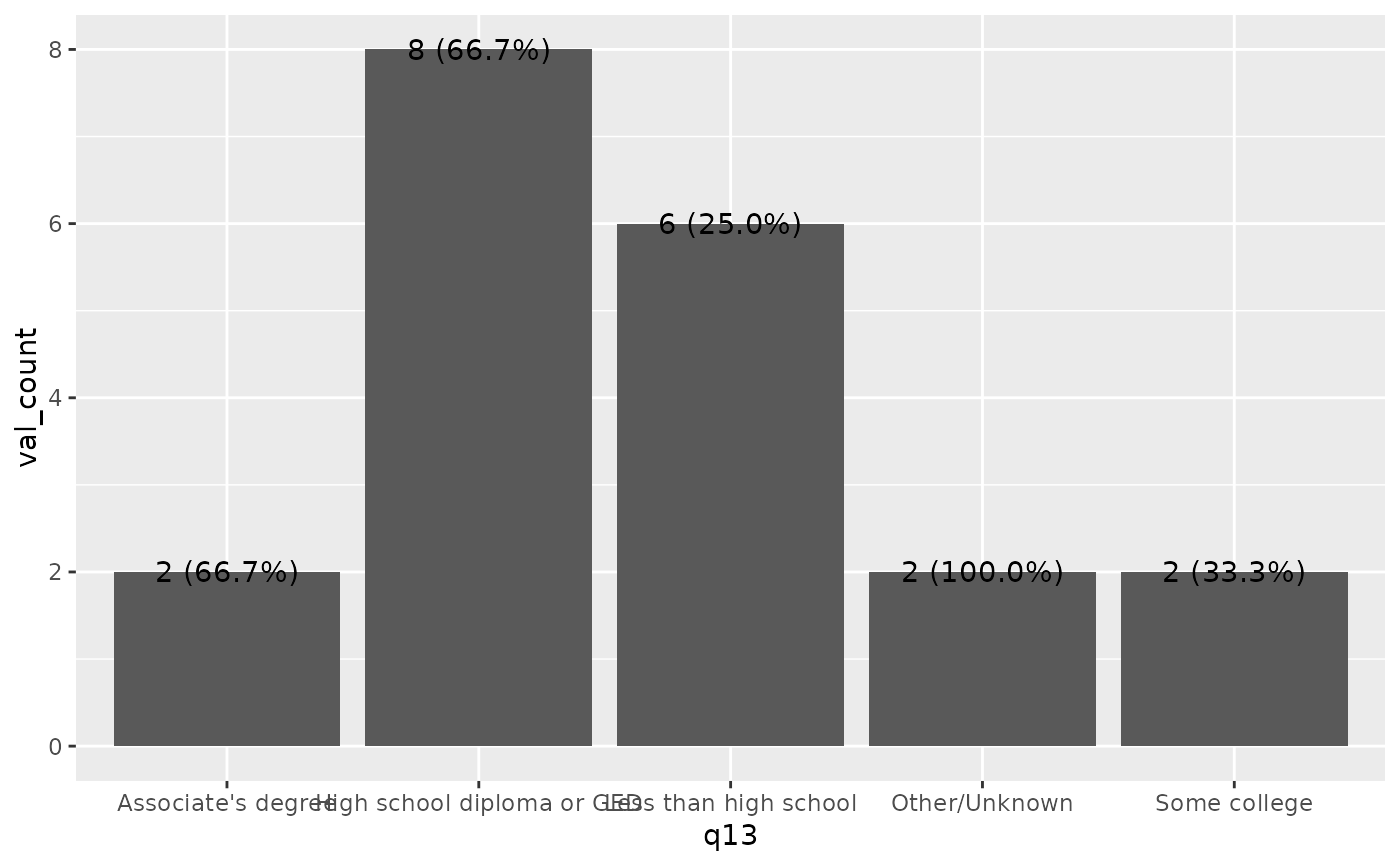
If plot = FALSE `yes_pct` will return a data frame with summarized data. If plot = TRUE `yes_pct` will return a ggplot object to visualize the summarized data. Defaults to plot = FALSE.
Examples
# Output a data frame
yes_pct(bns2_pkg_data, q13, q14_1, value = "Yes")
#> # A tibble: 5 × 5
#>   q13                        count val_count   pct npct
#>   <chr>                      <int>     <int> <dbl> <chr>
#> 1 Other/Unknown                  2         2 1     2 (100.0%)
#> 2 Associate's degree             3         2 0.667 2 (66.7%)
#> 3 High school diploma or GED    12         8 0.667 8 (66.7%)
#> 4 Some college                   6         2 0.333 2 (33.3%)
#> 5 Less than high school         24         6 0.25  6 (25.0%)

# Output a plot
yes_pct(bns2_pkg_data, q13, q14_1, value = "Yes", plot = TRUE)
