Creates frequency table
nperc_tbl_MATA.Rd`nperc_tbl_MATA` can be used to create a table showing the n counts and percentages for each option in a mark all that apply question.
Arguments
- df
A data frame used to create the table.
- vars
A vector of variable names to include in the table (all vars have to be dichotomus). Input the desired variables as if you were selecting variables using dplyr's `select()` function.
- value
The value in the rows of `vars` (only one value across all variables).
- row.names
The name of each row in the table. Should be equivalent to each option in the select all that apply question.
- punc
The punctuation at the end of the row names.
- plot
If TRUE, returns a count and percent bar plot instead of a data frame. Defaults to FALSE.
Examples
# Table
nperc_tbl_MATA(df = bns2_pkg_data,
vars = c(q14_1:q14_4),
value = "Yes",
row.names = c("I am a broke college student",
"No good restaurants",
"I like cooking"),
punc = ".")
#> # A tibble: 3 × 2
#> col npct
#> <chr> <chr>
#> 1 I like cooking. (n = 46) 33 (71.7%)
#> 2 I am a broke college student. (n = 47) 20 (42.6%)
#> 3 No good restaurants. (n = 47) 3 (6.4%)
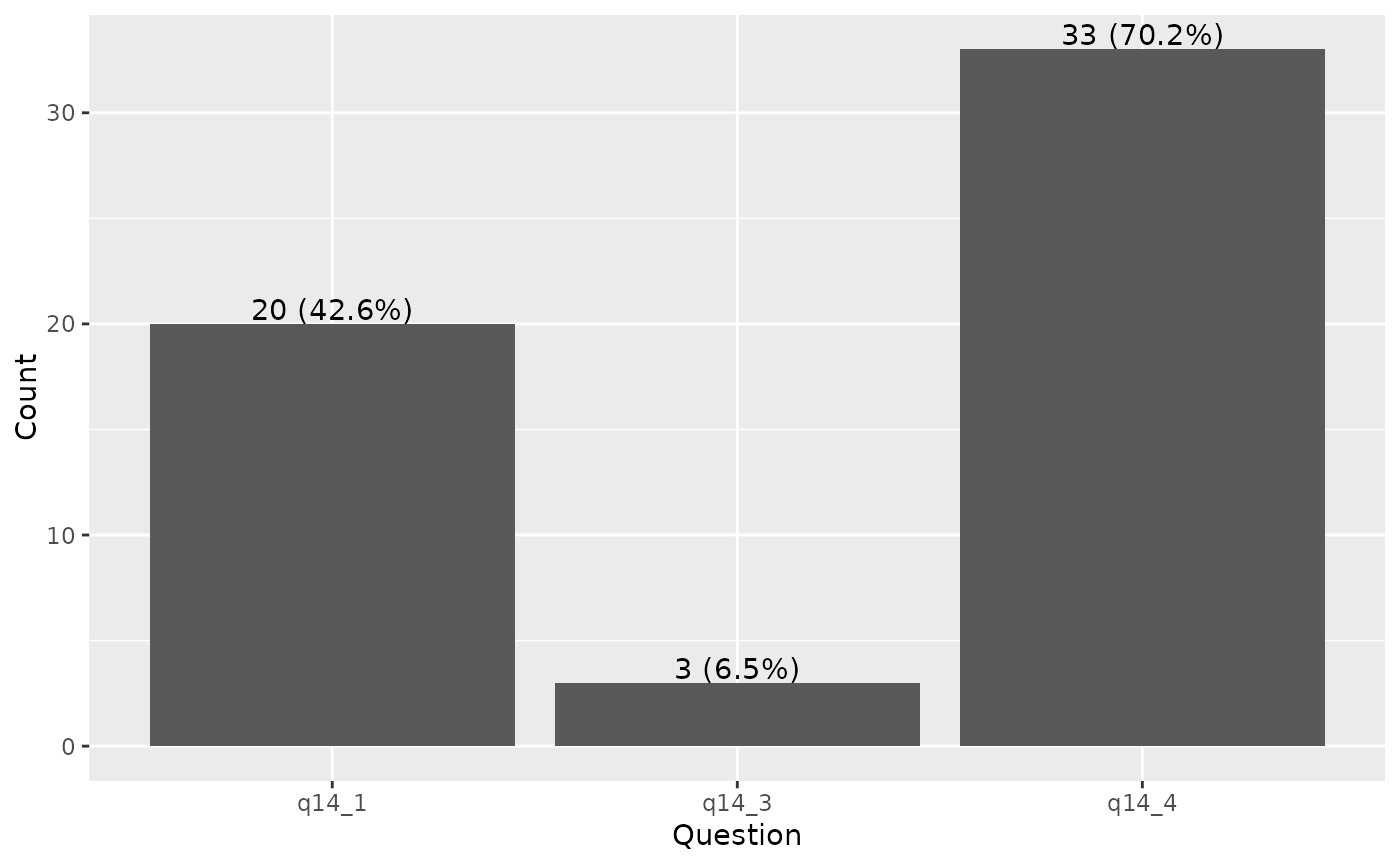
# Barplot
nperc_tbl_MATA(df = bns2_pkg_data,
vars = c(q14_1:q14_4),
value = "Yes",
plot = TRUE)